All the World's a Stage
Solving the Bellman equation for personal finances provides a way to find ‘optimal’ trajectories that guide spending and saving decisions in the same way NASA guides probes to make a target trajectory through the solar system.
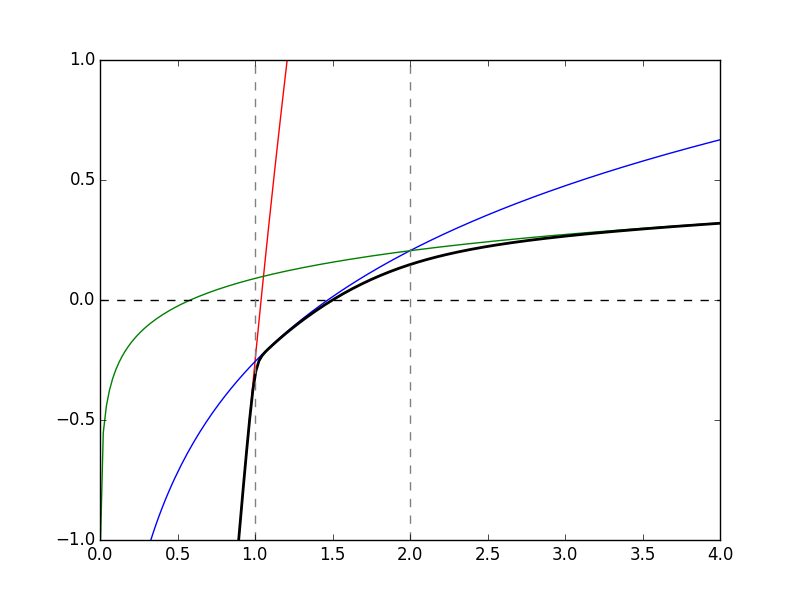
After solving this a few times, I wasn’t happy with the earlier utility function. It always ended up spending at poverty level until it was possible to escape the pull of gravity altogether with wealth flying off to infinity. It might be a good choice for an ascetic, however, for most people, it would be better to tweak the utility function to create three separate segments:
- a steep logarithmic rise below poverty level (FPL)
- a medium logarithmic rise between 1x and 2x FPL
- a slow logarithmic rise above 2x FPL
The graphic is here:
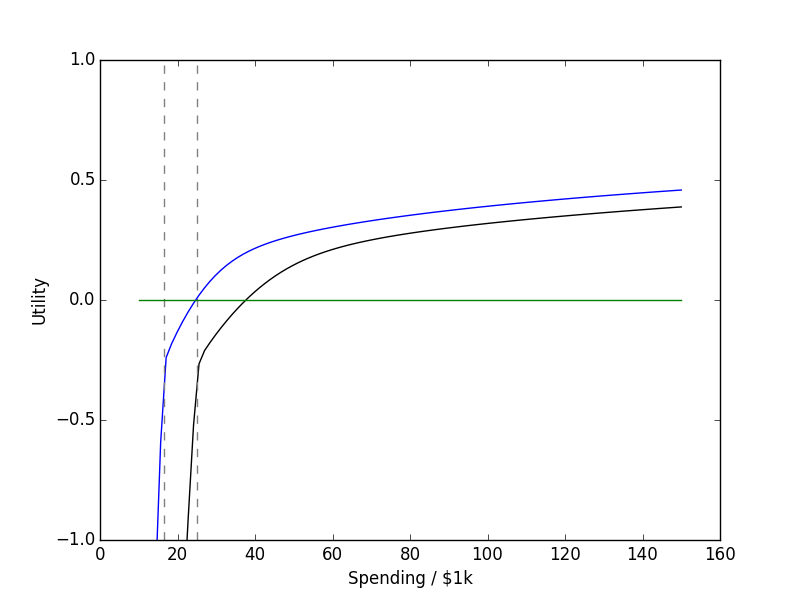
| Three Segment Utility (normalized to 1) | Utility for \( C_0 \) = $16,460 and \( C_0 \) = $25,100 |
|---|---|
 |
 |
and the equation is here:
$$ U(t = C/C_0) = \mathrm{const. } - \log(e^{-A\log t} + e^{-B\log t - y_0} + e^{-C\log t - z_0})/B $$ where \( y_0 = A \log(1) - B \log(1) \) and \( z_0 = B \log(2) + y0 - C \log(2) \) are determined by the fixed crossing points, \( C = 1 \) and \( C = 2\).
I also added a constant to the utility function so that it crosses zero at \( C = 1.5 C_0 \), 1.5 times the minimum spending. I’ve been able to get by just fine spending less than 1.5x the FPL, so it’s probably a good target. Note that this is a spending target, not an income target - since income at the FPL is an unsustainable living condition.
I chose to work backward from a ‘final’ utility function at age 90 based on \( C_0 \) = $5,000 in today’s dollars, representing the low-end cost of a casket funeral. The utility function above targets 1 to 2x this amount, so tries to attain between $5,000 and $10,000 – also reasonable.
I used the median household income of $59,055 to guestimate a starting salary of $55,000 for an average household that starts work at 22 years of age. I didn’t add $55,000 as income though, but rather added 85% of that to account for taxes and other witholdings that inevitably disappear – possibly never to be seen again. The plots below also assume the interest rate on savings stays at 3.4 and inflation is 3.56. It also assumes income grows at 4%, which is just 0.5% after inflation. All numbers are inflation-adjusted to Jan., 2019 dollars. I also planned for the following events:
- annual minimum costs of $25,100 from age 18 until 42
- Early retirement at age 55
- Two children at age 22 and 23 (extra medical expenses of $2,000 each)
- ‘donations’ of $20,000 to each child at age 18
-
annual minimum costs of $16,460 from 42 onward (2-person household)
Yes, I know this isn’t a lot to donate to college tuition, but they should be applying to scholarships and dealing with their own finances, shouldn’t they? Also, there is negative cash flow between ages 18 and 22, since they should be studying instead of working. In my model, students have to deal with being financially unhappy because of that. In reality, they will take out loans and pay them off as part of their spending over the next 5-10 years.
With all that background, let’s examine the ‘value function,’ \( V_t(W, R) \) that results. Since the function is a sum over all years from \( t \) until 90, I’ve divided through by years remaining to show the yearly average in the plot below, so \( \langle U\rangle = V_t(W, R) / (91-t) \). If everything goes ‘on average,’ the trajectory (arrows) would go horizontally to the right, then to the left. In simulations (below), it dips down, then goes up in the most probable cases. The key point is that if \( \langle U\rangle \) goes up with time, the future is getting brighter.

We see that the value function looks roughly logarithmic at every age, but scales and shifts a lot while bending a bit over time. The horizontal axis shows current wealth in 2019 dollars and the vertical axis plots the ‘lifetime average value’ received by a random group of folks at that particular wealth level and age. The curves further to the right (near early retirement at 55) are hurdles, for which one needs significant savings/investments to make it past unscathed. The arrow says a 55-year old retiring today (who knows for certain they will not live past 90) should have nearly $1M in investments.
Oh, I forgot to say above that we’ve vexed our player by putting in a 0.5% chance of losing all job income in any given working year, along with a fluctuating income that can go up or down by 10% from the expectation each year. This idea (and model) comes from Christopher Carroll’s paper I talked about earlier. Formally, the multiplier has a Gaussian distribution with \(\sigma\) = 0.1.
To break this down, let’s contrast it the famous monologue from with Shakespeare’s ‘As You Like It’. The plot above actually shows a financial view of the seven ages of man. If the age divisions are financial, we can even speculate on starting and ending year for each age.
| A |  |
With 4 years of zero income ahead, school-boys in this scenario are not looking forward to college unless they have maybe $60,000 saved up. Luckily, most are more wistful than the Bellman equation. This trouble goes away quickly between 18 and 22. |
|---|---|---|
| B | The future looks very rosy all around at 22, the age where work begins in this scenario. Regardless of how savings do over the next many years, or how bad college life was, spending can now be high, and future income can take care of any issues. |  |
| C |  |
Reality has set in, and expectations are getting higher. This is apparently do or die time. Setbacks here could delay retirement. |
| D | With savings at maximum, the justice has a lot to loose. It’s only natural those nearing retirement would be concerned with fairness, personal property, and not changing the rules! | 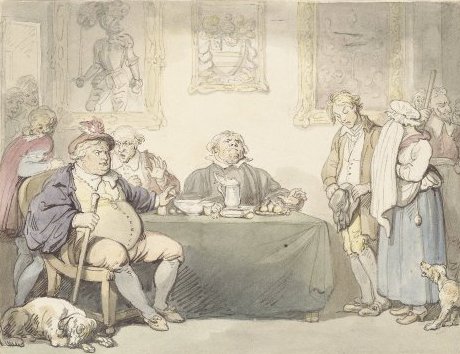 |
| E |  |
Let’s say the stage just after retirement belongs to the lean and slippered pantaloon (on the right here). Spending is dialed-in, and the cash flow will be negative for the forseeable future. Still, donations could make up part of that spending. |
| F | Interestingly, the value curve for second childishness also returns back to almost resemble that for the infant as well… |  |
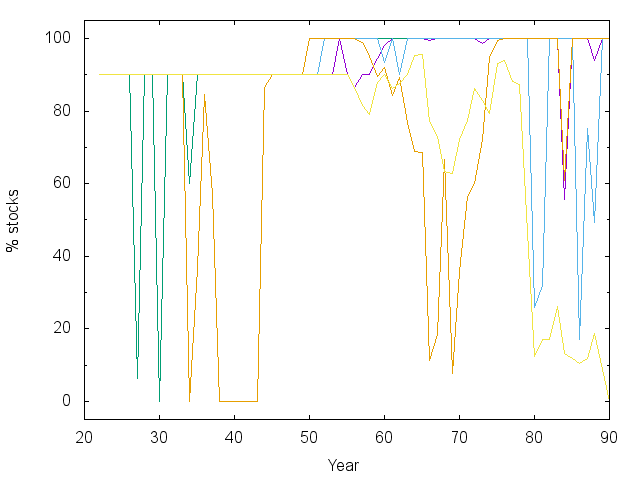
We should also examine some trajectories that show how a test subject fares when following this advice under random income and investment performance. After making some test trajectories, I realized there was a really strong preference for a 100% stock investment strategy. Everyone knows this is risky, and it turns out that quite a few trajectories crashed and got stuck spending at FPL for the final 10-15 years - ouch.
So… I intervened and capped stocks at 90% of the portfolio unless the current wealth was enough to support $30,000 in spending for each remaining year. This is the recommendation I get from CNN’s asset allocator for even the most risk tolerant, long-term investor. That’s why you can see hard stops at 90% in several plots below – the Bellman equation encourages risky behavior because it’s 50/50 make it big or lose everything at some stages of life.
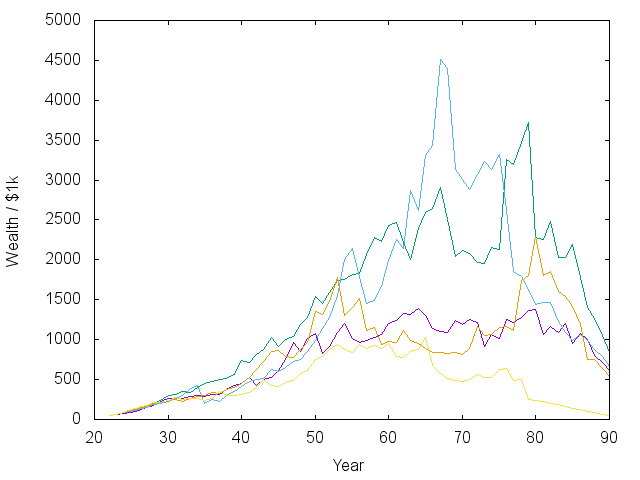
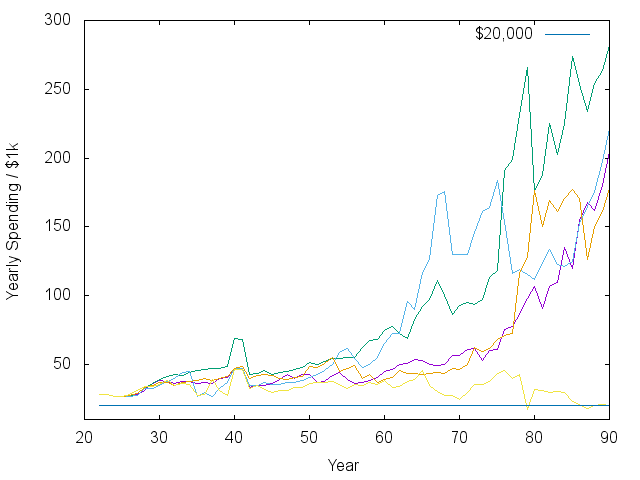
| Wealth vs. Time | Spending vs. Time |
|---|---|
 |
 |
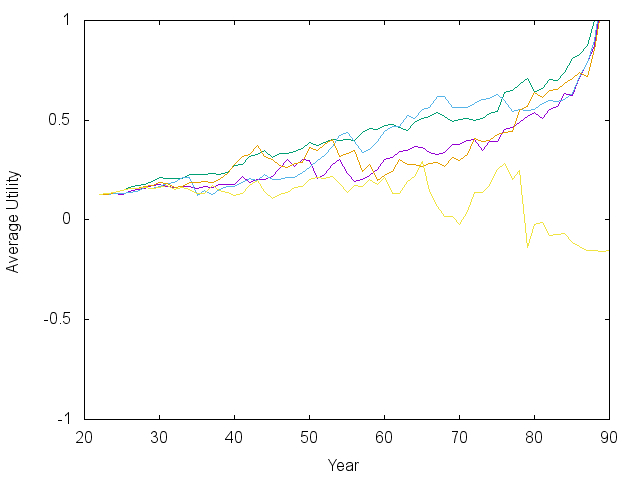
| Expected Average Utility | Investment Strategy |
 |
 |
With that caveat, I would consider most of the trajectories above successful, showing that it really is possible to retire at 55 on the median income. Note that the spending vs. time plot has already counted for inflation. The exponential rise means an exponential increase in real spending. There is also a noticeable bump and dip in spending as the kids are sent off into the world. I should say that in some other models I did where inflation was not a predictable 3.5%, then it was harder to make steady progress.
Note also that there are periods of large swings in the market and in asset allocation. The model I’m using allows the interest rate on savings to fluctuate – sometimes above 10%. When that happens, like early on in the green and orange lines, the model says to jump into the bond market. Such jumps could contribute to the boom/bust cycle…
Finally, I am not an investment advisor, so don’t take any of this advice without consulting an actual, qualified one. I explicitly disclaim liability for any misfortunes of anyone else based on anything I write down or say!